Heat Pump vs Furnace Calculator for Natural Gas Replacement

A MassLandlords air source heat pump vs furnace calculator has been developed to help owners, managers, and builders evaluate operational costs of all-electric buildings. The spreadsheet calculator allows members to model an apartment, a natural gas furnace or boiler, and a variety of commercially available air source heat pumps. Then each heat pump can be compared to the natural gas furnace or boiler for annual operating cost. This tool is a feature available to members only and will work to compare heat pumps vs baseboard or ducted heat.

Jump to

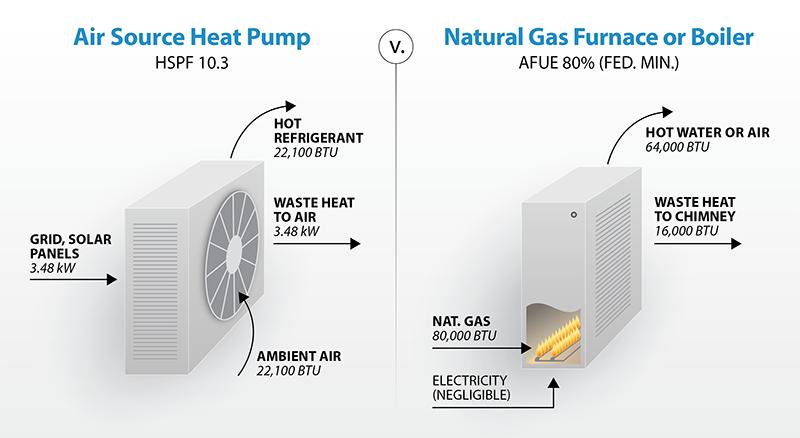
Key differences: You need 3 of these heat pumps to equal 1 of these boilers. The heat pump moves much more heat than you pay for, because the heat comes from air not fuel.

Why Do We Need a Heat Pump vs Furnace Calculator?

This tool is needed because natural gas is near historic low prices, leaving many retrofits and new construction projects continuing to install natural gas as a primary heat source without thinking. Natural gas has been an essential and improving technology for over a century. Why shouldn’t we keep using it? Because natural gas is regrettably a dead-end technology, like so many other technologies before it. There are four main reasons:

First, natural gas is explosive, as we saw tragically in the Merrimack valley gas explosions of 2018. The infrastructure needed to keep it flowing safely is old and aging fast.

Second, natural gas is a potent source of greenhouse gases, not just when it burns, but especially when it leaks. Natural gas is mostly methane, and methane is a more potent greenhouse gas than carbon dioxide. Gas leaks out of pipes at the rate of tens of thousands of metric tons per year in Massachusetts alone, from approximately ten thousand new leaks annually.

Third, even if you don’t care about safety or the climate, natural gas is decreasingly available to businesses: natural gas moratoriums in Western MA have occurred, and in other parts of the state, as well, new hookups have been delayed or denied. (Gas moratoriums have even trapped owners with preexisting service after the previous renter failed to pay their bills.)

And fourth, natural gas is non-renewable. Barring some unforeseen revolution in chemical engineering, we will eventually extract all that remains available to us, driving prices up in the long-term. (The EIA predicts residential gas prices will rise 1% per year for the next 30 years, whereas residential electricity prices will fall.)

These four reasons add up to a fifth concern, which is that Massachusetts seems likely to tax or regulate natural gas so as to increase its price faster than economics would indicate.

All of these factors make it uncertain how much a new natural gas furnace or boiler will cost to operate over the life of the system. One thing is clear: there is no upside. Natural gas will likely never be cheaper or more available than it is at time of writing. Heating systems should be selected for a 10- to 30-year service life, over which the uncertainty that comes with natural gas looms large.

Air source heat pumps, on the other hand, have a very predictable operating cost. The price of electricity rises more or less with inflation. Local solar generation gives you the option of taking supply costs into your own hands and monetizing solar with renters. This makes it possible to know with relative certainty the lifetime operating costs of an air source heat pump. Unlike natural gas furnaces and boilers, which seem unlikely ever to be cheaper, air source heat pumps seem likely never to be more expensive than they are today (after adjusting for inflation).

Note that we are focusing on operating costs, which are only one of thee three primary costs alongside installed cost and maintenance. This tool focuses on operating cost of heat pumps vs natural gas.

This tool is unbiased. It shows that certain air source heat pumps included in the model are three times as expensive to operate, on a per-BTU basis, than a natural gas furnace or boiler. On the other hand, it shows other heat pumps are cheaper than natural gas furnaces or boilers. This tool uses real performance data and actual weather to prove that system selection matters.

We first wrote about how heat pumps are now cheaper than natural gas in April 2018. Since then, we have received objections to that article like the following:

“If a unit has resistance heat, insulation and heat pump installation are great ideas, but the concept of converting from a boiler to heat pumps will never, ever, be economically justified.”

The spreadsheet proves this comment was broadly correct, if one throws a dart at any number of heat pump models. But the comment is specifically wrong when the apartment is insulated, the heat pump is optimized for cold weather, and the system is sized and selected for the space.

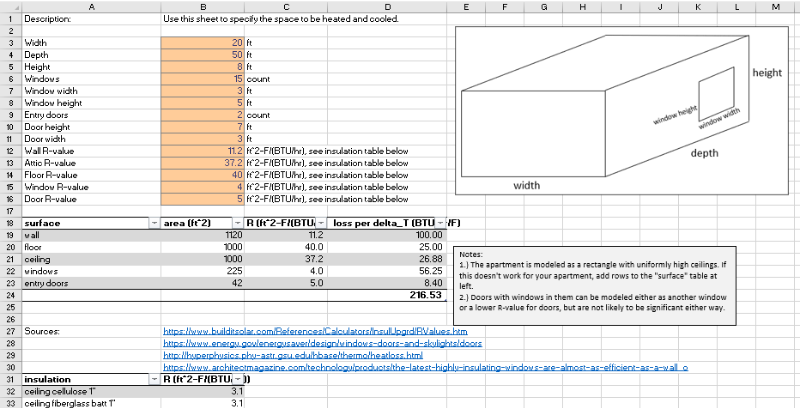
The heat pump vs natural gas spreadsheet tool models an apartment as a simple rectangle with areas and R-values for the various surfaces include windows, doors, etc.

How to Use the Heat Pump vs Furnace Calculator Spreadsheet

The air source heat pump vs natural gas calculator spreadsheet evaluates the relative operating costs of air source heat pumps vs a natural gas boiler or furnace.

The spreadsheet uses built-in Excel formatting:

1.) Enter data in orange cells in the "apartment", "gas" and "air source" worksheets in this workbook.
2.) Look at the "comparison" worksheet. Select the model of heat pump you wish to compare.

The tool uses 2019 daily weather data from the National Weather Service’s station at the Worcester, MA regional airport, near the geographic center of MA.

New models of heat pump can be added to the tool and compared. Instructions are provided in the spreadsheet.

Known Limitations of the Heat Pump vs Natural Gas Calculator Spreadsheet

As with any model of the real world, this spreadsheet tool is not reality. It is only meant to approximate real differences between natural gas boilers, furnaces, and air source heat pumps.

This tool requires familiarity with Microsoft Excel. You can learn excel online.

The 2019 actual weather loaded as a default was recorded at Worcester Regional Airport, near the geometric center of Massachusetts. Massachusetts has several different climate regions. Central plain data is not necessarily adequate to compare Berkshires, North or South Shore, or Cape and Islands. If Worcester isn’t close enough to your climate, you will need to update the "heating degree days" table in the worksheet. You can load data from a different location using DegreeDays.net.

Past weather is no guarantee that future weather will be the same. This tool will approximate a correct answer for regions outside of Massachusetts only when you update the tool with local data.

This tool compares heating only, not cooling. The tool does estimate air source cooling costs, but in New England there is no commonly used natural gas cooling option for comparison.

The comparison produced is only as good as the data you enter. Make sure you have correctly entered data relating to the boiler or heat pump you are considering. The default furnace is 80% AFUE, indicating an old system (retrofit). New construction might install a 90% or better system.

Before making any decision to purchase, consult with a licensed HVAC installer to be sure that the system you want is appropriately sized for your building and climate. An HVAC installer may refuse to retrofit an existing building to heat pumps on the basis that your insulation is inadequate, or for other reasons. This excel model may not accurately reflect your building conditions.

This tool does not compare cost of capital (installation cost).

This tool does not compare maintenance costs.

Maintenance is a significant consideration, especially if the heat pump selected requires its refrigerant lines and fittings be replaced on a shorter interval than the gas system being compared. Many gas systems are “low maintenance” for their entire service life of 30 years. Heat pumps on the other hand may follow a ten-year maintenance cycle, like a water heater. They may be “very low to no maintenance” for approximately ten years, and then depending on the make and model, may require a new condenser, a partial rebuild, and/or new refrigerant fittings and seals.

This tool does not account for historical variations in gas and electricity prices. This tool does not account for the probability that gas or electricity prices may change in the future.

The heat pump vs furnace calculator will work for boilers, furnaces, or any natural gas heat source. Heat pumps are extensively modeled. An easy-pull down lets you evaluate different heat pumps. Excel users, add your own heat pump and compare.

How the Heat Pump vs Furnace Calculator Spreadsheet Works

The heat pump vs furnace spreadsheet calculator is designed to take performance data from the Northeast Energy Efficiency Partnerships (NEEP) “Cold Climate Air Source Heat Pump List.” The NEEP dataset provides a variety of metrics on thousands of model numbers across dozens of brands. Each page in the dataset indicates how much heat a given heat pump can produce at a given ambient temperature, and how much energy this costs. Many heat pumps on the NEEP list are variable speed. The heat pump vs. natural gas calculator spreadsheet assumes all heat pumps are variable speed. The spreadsheet tool also assumes that performance varies linearly from low to high speed.

Let’s consider the performance of an example variable speed heat pump: the Trane Mitsubishi multizone ductless (model TUMYH0481AK40). When the ambient temperature is 17 Fahrenheit, this system moves a minimum 11,628 BTU/hr at a cost of 0.92 kW. It can increase to full speed and move 59,011 BTU/hr at a cost of 5.44 kW.

When the ambient temperature is colder, heating performance generally degrades. The Trane Mitsubishi model above will require 7.92 kW to produce only 54,000 BTU/hr at 5 Fahrenheit. In other words, it will produce 8% less heat for 45% more effort. (If you are carrying out new construction, you should evaluate ground source heat pumps as an alternative to air source. Ground source heat pumps operate on the same principle as air source heat pumps, but benefit from a constant, higher ground temperature of around 50 F.)

For each day in 2019 (or any other year you enter), the air source heat pump vs. natural gas calculator estimates the heat loss from the apartment in terms of BTU/hr. The tool then calculates how many condensers are required to hold the apartment at its interior temperature set point each day. The system is automatically sized for the coldest day in the year, with one or more condensers being modeled as needed. Each day of the year, the sized system will cycle one more condensers between off, minimum and maximum wattage.

Metrics like “Heating Season Performance Factor” (HSPF), Seasonal Energy Efficiency Ratio (SEER), and other metrics are specifically not considered in this tool. These metrics are useful to identify makes and models of interest. But because these metrics are gross estimates of efficiency, the metrics cannot always be relied upon to size a system under real world variability.

The model assumes heat pump performance varies linearly between design points, even though the table is broken into discrete design points of 5 °F, 17 °F and 47 °F. Example: the output and power consumption at 11 °F will be halfway between the performance at 5 °F and 17 °F.

Selected Comparisons

The spreadsheet’s default apartment is a 1,000 square foot rectangular unit located below attic insulation and above another unit heated separately. It is assumed that there are 15 large EnergyStar windows, 2 steel-clad doors, and MassSave-style blown cellulose in the walls. It is assumed there are no leaks.

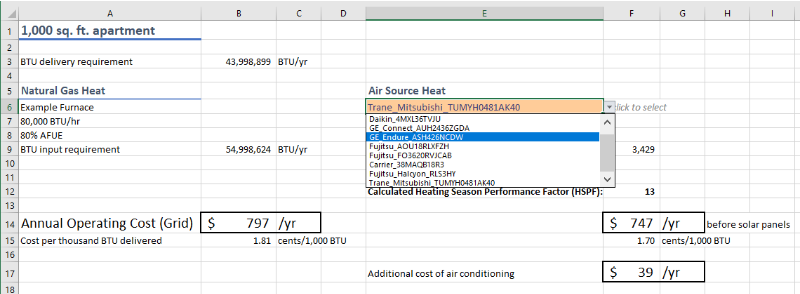
The spreadsheet’s default natural gas heat is an 80% efficient boiler capable of 80,000 BTU/hr input (64,000 BTU/hr output). The modeled annual heating cost for this boiler is $797 per year.

With no bias other than brand name recognition, we selected half a dozen varieties of heat pumps to evaluate. Some of these are ducted, which would likely not be used in a retrofit situation. Others selected were ductless.

In general, heat pumps that fared impressively badly were underpowered for a cold climate. For instance, consider the Fujitsu AOU18RLXFZH, with a maximum output of less than 25,000 BTU/hr at 47 Fahrenheit. Although cold-rated, meaning it can generate heat in cold climates, it is not optimized for cold climates. This system requires 2 condensers to keep the well insulated apartment at its set point on the coldest day of the year. The modeled annual heating costs for this system are over $2,404 per year. This is three times more expensive than natural gas. In terms of HSPF, it is equivalent to electric resistance heat. This heat pump is really designed to be an air conditioner most of the time.

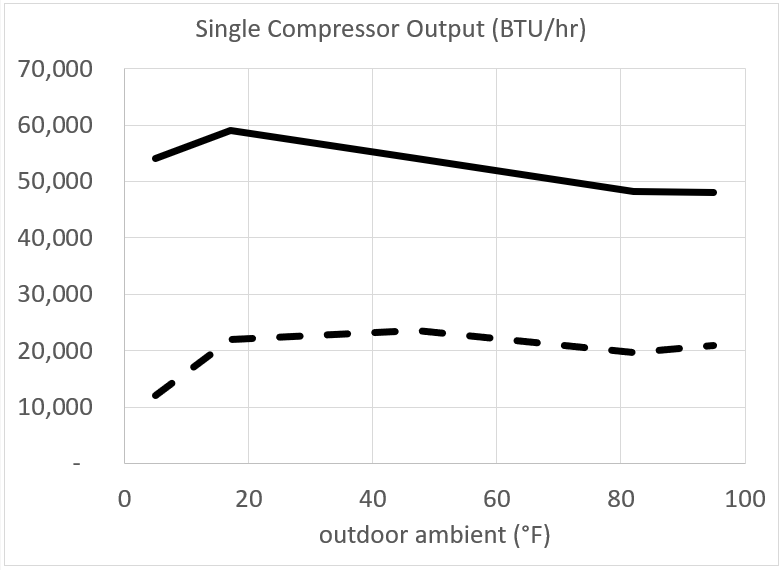
Heat pump performance varies as a function of outdoor ambient temperature, meaning what works best in the Mid-Atlantic won’t be optimal for New England and vice versa. Shown in solid, a Trane Mitsubishi heat pump; dashed, a Fujitsu. The brand is not important. What is important is the overall height of the line (how much heat output, meaning how many condensers) and where the line peaks. The solid model would be a better all around choice for New England, while the dashed model may be a better all around choice for the lower Mid-Atlantic and DC.

On the other hand, consider the multizone ductless Trane Mitsubishi TUMYH0481AK40. The maximum output of this system is 59,011 BTU/hr at 17 Fahrenheit. At this power output, it is as powerful as the natural gas boiler. This system requires one condenser to keep the apartment at its set point. Even on the coldest day of the year, the heat pump does not exceed a run time fraction of one-third, meaning it will be off two-thirds of the time. This is very similar to the cycles experienced by powerful natural gas boilers. The modeled annual heating costs for this system are $628 per year, less than the natural gas boiler by $169 per year.

This Trane Mitsubishi model PH has a Heating Season Performance Factor (HSPF) of 13.5, making it both cold rated and efficient at low temperatures. https://www.trane.com/residential/en/products/ductless-systems/mini-split-indoor-unit/ph-series-outdoor-heat-pumps/

The spreadsheet calculator allows us to calculate a break-even maintenance and install cost. For instance, if this heat pump requires less than $169 worth of additional capital every year, in terms of maintenance and depreciation, then it will break even against natural gas.

What if we change the assumption of an 80% efficient boiler and instead model a 95% efficient boiler? Then the natural gas costs drop to $671 per year. This makes natural gas cheaper equivalent to or just slightly more expensive than the Trane Mitsubishi heat pump.

As discussed in the introduction, savings from more efficient gas furnaces and boilers may be offset by future cost increases to natural gas supply.

Depending on your local electricity rate, you may need to lower or increase the rate in the spreadsheet.

Any of these factors can influence the comparison between a given heat pump and a given natural gas boiler or furnace.

Key point: a properly selected heat pump running on grid electricity costs no more than a natural gas boiler to operate.

In all scenarios, the heat pumps deliver summer air conditioning for approximately 5% more operating cost. In New England, air conditioning is not a driving factor. There is generally a lot more heat required than air conditioning.

Solar panels are not modeled. Depending on the size of the roof, a typical three-decker would produce order of magnitude 10,000 kW-hr per year. (It might be only 7,000, it might be 15,000, your roof will vary.) The Trane Mitsubishi heat pump modeled requires 3,000 kW-hr per year to operate. This means two to three units can be heated without grid electricity.

Key point: properly selected heat pumps in three story housing or less may be largely or fully powered by rooftop solar.

The cost to install and maintain your heat pumps and or solar panels must be modeled separately.

Note in the above analysis, which positions a heating-optimized Trane Mitsubishi against a cooling-optimized Fujitsu, that we are not expressly or by implication endorsing or denigrating any brand. Any manufacturer may have heating-optimized and cooling-optimized models. You must select a heat pump that optimizes for your design point.

How to Find a Cold Climate Heat Pump (CCHP)

Cold weather power output seems to be the most important estimator for whether a heat pump will fare well in the spreadsheet. Look for heat pumps that have a high BTU capacity at the low end of the temperature range. Look especially for heat pumps whose maximum output is in the 17 Fahrenheit range. A heat pump optimized for cooling at 90 Fahrenheit will not fare as well as a heating-optimized heat pump, even if it is so-called “cold rated”.

Note that the Seasonal Energy Efficiency Ratio (SEER) is not a predictor of heat pump performance. SEER is a measure of cooling performance. Heat pumps may have a SEER, but that applies only to their cooling. For heating, heat pumps are rated by Heating Season Performance Factor (HSPF). HSPF is calculated as the total BTU’s delivered divided by the total W-hr energy cost. The heat pump vs natural gas calculator calculates an unofficial HSPF based on actual weather.

Will Renters Pay a Premium for Green Heat?

Maybe, but it doesn’t matter. It is already known that renters do pay a premium for “heat included,” and the recommended monetization for heat pumps is detailed in our article “Can Massachusetts Landlords Charge for Solar?”. This article describes how you can provide heat at zero operating cost and charge effectively the cost of oil heat included. This is a straightforward “early adopter” opportunity for landlords and rental housing providers.

Aren't New Gas Furnaces and Boilers Very Efficient?

You may have heard other landlords or contractors talk about how efficient their new high efficiency gas boiler or furnace may be. Even if a boiler or furnace is 100% efficient at turning gas into heat, it still produces nearly as much CO2 as any less efficient boiler or furnace. That's because you can't produce heat from natural gas without producing CO2.

The efficiency of a boiler or furnace describes how much heat energy is released from the natural gas. It does not say anything about how much CO2 is produced. A typical apartment-sized gas boiler or furnace heating a decently well insulated and sealed apartment will produce approximately 3 tons of CO2 per year.

Boiler or Furnace Thermodynamic EfficiencyCarbon Dioxide emissions estimated by this spreadsheet (metric tons per year)
50%4.66
80%2.91
90%2.59
95%2.45
100%2.33

Heat Pumps vs Baseboard Heat

This model considers only the operating cost of air source heat pumps vs natural gas. The installation costs are an important factor especially when considering retrofits. To install minisplit heads, you may have to install several heads or condensers per unit, both inside the unit and outside.

In general, new construction projects or total gut renovations will find heat pump installation costs to be less.

It may be possible to replace a natural gas furnace or boiler without entering a unit. A typical natural gas boiler will output water at 180 Fahrenheit. If you can adjust your boiler temperature down to 120 Fahrenheit and your apartments still maintain their temperature over a winter, then you are a candidate for what is called a “air-to-water” heat pump retrofit. This would use the existing forced hot water pipes, but instead of burning natural gas at the boiler, an air source heat pump would heat the water. Note that you will not have access to air conditioning using an “air-to-water” retrofit.

Heat Pumps vs Natural Gas Conclusion

Whether you use heat pumps or natural gas, the best first investment you can make is insulation and air sealing.

If you try to heat an uninsulated, leaky apartment with heat pumps, it will be very expensive and/or unsuccessful.

If you pick a randomly selected “cold rated” heat pump, it will not work well for your apartment.

The best “cold rated” heat pumps are optimized for heat output at cold temperatures. Look for high HSPF.

If you pick an optimized “cold rated” heat pump and size the system correctly for your insulated and air-sealed apartment, it will be cheaper than natural gas to operate.
If you couple heat pumps with solar, your operating costs can go to zero.
Maintenance and installation costs must be modeled separately from operating costs.

Technical FAQ/Spreadsheet Doesn't Work

I can't get it to recognize a new heat pump

This is likely caused by inconsistent naming. Four things must have the same name:

  1. The worksheet that contains your heat pump performance data;
  2. The table that sits in this worksheet (see Excel > "Table Design").
  3. Any one Column A cell in the "registry" worksheet.
  4. The orange select in the "comparison" worksheet.
screenshot showing correct naming for a new heat pump

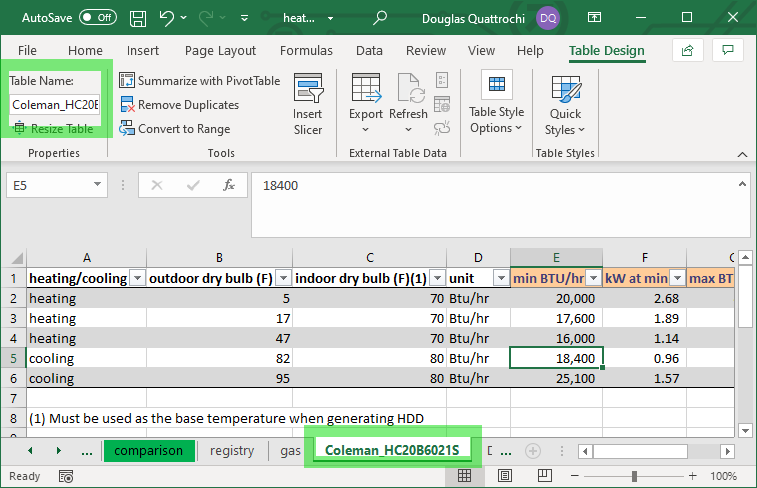
The most common name to miss is under "Table Design."

See Also

External Links

Energy Information Administration

Energy Department

Resources

To access this benefit, you must be logged-in and a member in good standing

Log in or join to access all savings, benefits and resources

Past Presentations

Webinar: Heat Pump vs Furnace Calculator


Heat Pump vs Furnace Webinar

Presenter:

Douglas Quattrochi - Doug

Assistant:

Naomi Richardson – Naomi

[Start 0:00:00]

Presentation

Doug: Just before we get started, some fast facts about MassLandlords. We're a 501(c)6 non-profit trade association. Our mission is to create better rental housing particularly by helping owners earn profitable, compliant quality businesses. We need to make money each year to provide housing long term. We need to follow all the laws to be effective advocates to change them. We want to be proud to be associated with one another.

We are democratically governed. I am the executive director and I report to an elected board of directors and we have an ongoing policy priority survey where we decide how to allocate resources. We've got 2 000 dues paying members in good standing 6, 000 subscribers, round numbers, 300, 000 site visitors. Events like this are supported usually by membership dues and so on so please join if you're considering joining MassLandlords. It’s well worth it. Dues pay for themselves.

There's a lot more folks besides just me, although you see me I do a lot of these events. A lot of folks work at MassLandlords on a full and part-time basis. Speaking of which, we're running a crash course. we have an attorney who helps teach that along with me. We still have seats available. It’s two days tomorrow, the 20th and then the week after that Saturday, the 27th. We cover everything you need to know to operate rental property. We also are going to really focus on changes since the pandemic started, so a lot of court process has changed and so on and we limit it to 16 attendees so everybody has a chance to ask all the questions that they want.

At today's webinar we're going to talk about heat pumps, which is something we don't cover often enough. There's a whole lot of building structure and infrastructure that we really want to help members with so that's what we're going to focus on today. This is going to be a detailed walkthrough of the spreadsheet tool that we have developed to help you compare natural gas to heat pumps.

I’m assisted today by Naomi Richardson. She's our community builder and accountant. If you have any trouble logging in or if you know someone's having trouble getting into the webinar, you can email hello@MassLandlords.net and Naomi will respond there, so let's get started.

This is our heat pump versus furnace calculator, and I’m going to start I’m going to change the screen share a couple times. I’m going to give you just an overview of the spreadsheet, how it works first. You can see where we're headed, then we'll come back to the slides and I’ll give you a little bit of a higher-level perspective about how heat pumps work and what we're covering, what we're not, and then we'll go back to the spreadsheet one final time for a detailed walkthrough.

First let me just stop that share and I’m going to pull up the view of the spreadsheet tool here, start the next share. I have two monitors I’m working with. Thank you for your patience.

Okay so, here's the heat pump tool which I have downloaded from our website, heat pump versus furnace calculator for natural gas replacement. You can see a lot of this content up on the article as well and you can download the spreadsheet from there.

One quick note. Our event listing had previously linked to this page with an S in the word heat pumps. We've corrected that, so if you saw the event listing and you couldn't find the page, look at that event listing again reload it and it will take you to this page properly.

So where we're headed is this comparison tab. I’ll explain all these tabs in a little bit. The comparison tab is the main output of the model though. It shows that we've got a certain apartment being considered. We've got a certain default gas heating system. We've got an operating cost for that gas heating system, so those go together, and for comparison sake we've got an air-source heating system, so it doesn't use natural gas to get energy.

There's a menu in here that you can click, and you can select different models and as you pick different models it will help you to compare which ones would be more expensive than natural gas, where you to install them or which ones might be cheaper than natural gas, and for the sake of illustration we've loaded the spreadsheet with a variety of models including some that are just really terrible.

These models weren't designed to be heat pumps so that they can run in reverse. They're primarily an air-conditioner, so we've got a variety of different options to look at by default and it does produce a cost estimate sometimes much higher than gas, sometimes lower than gas, and we've got a couple graphs that we show as well, so you can see things about how often the heat pump has to be running and what its design points look like, so that's where we're headed very simply just a comparison is this going to be more expensive or less expensive than natural gas. I’ll walk through in detail how we can make this assessment.

I’ll point out right now, these numbers they're not designed to be a an actual budget, so for instance if you have a furnace of a certain make or model, you won't spend $797 a year on that because your set-points will be different, the weather will be different, maybe the boiler or furnace will get older, clogged, or dirty or something, so there's a lot of variability. It’s not meant to be an accurate prediction of reality. It's meant to be an accurate comparison of two different systems, so I think the comparison is the main point here and the individual numbers are not to bog us down.

[0:05:23]

I’ll stop that spreadsheet share, which shows where we're headed and I’ll go back to the PowerPoint here.

We'll just walk through some high-level perspective, so let me back up a second and explain how heat pumps work. On the left, we've got an air-source heat pump. On the right, we've got a natural gas furnace or boiler. I know furnaces and boilers are different, but we're treating them the same for the purpose of this comparison.

Heat pumps typically have a fan and they pull air in and they run it through a heat exchanger and that heats refrigerant. It takes electricity to do that. You can get that from the grid. You can get it from solar panels. There'll be some amount of electricity, and for the sake of our model, we're assuming that the electricity you put in to run the fan and move the refrigerant is essentially wasted so really the way heat pump works is it gets energy from the ambient air.

If the air is very cold let's say it's 20 Fahrenheit outside, the refrigerant that circulates inside it is even colder 10 Fahrenheit, zero Fahrenheit, or negative whatever, and that's how you get heat transfer from already cold air to some very cold refrigerant. Then through the magic of thermodynamics, you run that refrigerant through a cycle and when it's running through your apartment, it’s very hot, and that's how you get heat transfer from the hot refrigerant out to the apartment air.

That's different from how a boiler works or a furnace. You take natural gas as a combustible fuel and you use a little bit of electricity to run a pilot and to control some valves and vents and so on and you burn the gas. Boilers have a certain efficiency. An annual fuel utilization efficiency is the number used to describe a furnace in particular. There's a federal minimum of 80 percent. If you're installing new furnace, it has to be at least 80 percent efficient, so that's what we've got here in this example. You burn 80,000 BTUs, British thermal units, of gas. That's the measure of heat energy and you waste some of that out the chimney. The 20 percent efficiency, the 20 percent waste those are the same numbers there. Then you turn the rest of it into a hot water in the case of a boiler with hydronic heating or hot air in the case of a furnace with ducts, and that goes in to heat the apartment.

So that's the basic difference. An air-source heat pump uses electricity to run a refrigerant around a thermodynamic cycle and pull heat in from already cold air and put it into an already warm apartment whereas a boiler will burn a fuel.

We use our heat pump analysis in the context of the Northeast Energy Efficiency Partnerships Cold Climate Air Source Heat Pump list, kind of a mouthful. NEEP, Northeast Energy Efficiency Partnership, has this tremendous list which I’ll show later where they have all kinds of great searching and you can see individual heat pump models and they tell you all the things you need to calculate or predict performance. These are complicated that's where we spend most of our effort. Our model for the furnace is relatively simple.

I just want to put a point to that thermodynamic cycle what I was talking about earlier with the heat pump. This diagram is not brilliant because three of these steps likely happen in this one thing here and you've got this line kind of making it unclear where the compressor is or where the expansion device is. They're probably all in that unit, and then you've got if it's a ductless mini split, you've got a head in a unit this is the hot side. This is the cold side.

As I mentioned, you get this refrigerant running around in a loop. The way thermodynamics magic works is you can make it to be very, very cold and you can pull in heat from the outside and then you can compress it, put some electrical energy into it basically to bring it up to higher temperature and pressure and then that's what makes it able to deliver heat so it pulled the energy out from the cold air and delivered it in on the hot side, and it runs through an expansion valve or device that changes the thermodynamic properties. It changes the pressure and therefore changes the temperature as long as you keep driving electricity, you keep running refrigerant around the cycle.

I can go into that in more detail if anyone really wants to know but take it for granted that's how fridges work, that's how air conditioners work, and that’s how heat pumps work. Each heat pump has a certain design pattern. For instance, you look at the total number of BTUs output that it produces as a function of the outside air. Typically when we're looking at heat pumps, we're trying to heat the house when it's cold so it's important to know that when the outdoor temperature is around 20 Fahrenheit, a heat pump can produce a lot of output heat. When the temperature is around 80 Fahrenheit, these design points are for cooling. It might be called a heat pump, but remember it usually runs in two directions so you can have heat in the winter and you have air-conditioning in the summer.

[0:10:34]

Now heat pumps are not all created equal. The top line here, the dark line is for something that produces an equivalent amount of BTUs per hour as a furnace or boiler. A furnace or boiler the example we use was about 80,000 BTU. There are heat pumps that produce 50,000 to 60,000 BTUs and they're powerful and they're strong, and a single one of those can heat an apartment equivalently to a boiler or furnace.

Historically though heat pumps were weak especially designed for air-conditioning, and so even if they can run in reverse they might be designed to provide a limited amount of cooling when it's hot outside, so the fact that they run in reverse is kind of incidental to the fact that they're mainly an air conditioner, and of course their total output in terms of heat delivery or cooling delivery is going to be lower.

So you're going to see, we have different brands and models considered. There's no judgment on the brand or model. You've got to remember that some are designed for different things. Some are designed to be weak because they only have a small load to deliver. Some are designed to be strong because they're designed to heat an entire apartment.

Our spreadsheet is broken into a couple different sections. First we're going to model an actual apartment. We're not going to make it very complicated, but we're just going to make it a rectangle. We will have walls. We will have insulation in the walls if we want or we can take the insulation out. We'll have windows and doors. We can change the number. All those things determine how much it takes to heat an apartment.

Our spreadsheet will model actual weather. We're using 2019 as a starting point just because when we first developed the spreadsheet, we hadn't completed 2020 yet, but you could pick any time period. You could pick the most recent 12 months and you can update the spreadsheet. That's the power of a tool.

We model a gas furnace or boiler in pretty much the same way. We just assume that you've got some gas in and that produces some heat out and some waste heat based on inefficiency, a pretty simple model of a boiler. We could have gone into much more detail but because we're particularly trying to understand the new heat pump technology, we put our effort into understanding the detail of heat pumps rather than the nuances of boilers or furnaces.

We do model that heat pump in very great detail, so we have different speed settings, different power outputs. We can even size. The spreadsheet will size the number of compressors you need. Remember I said some of them are weak and they don't produce much output. Well if for some reason you want those, you can have multiple ones of those to heat an apartment. You can have two or three compressors per apartment if you want.

We do model something about the cost of gas and electricity. We kind of assume it's fixed, but there is a price in there. This gives us a continuous operating cost, so the spreadsheet can tell us given that we need to heat over the course of a year and maybe do a little cooling how much is going to cost us to do that.

We do not model the installation cost. Those of you familiar with retrofits will know that heat pumps can be very difficult. Adding duct work can be very difficult. That's why a lot of people tend to select heat pumps that are duct less. They run the refrigerant line directly into the unit, but you could have a heat pump with ducting, a proper HVAC system. Instead of a furnace you get a heat pump that delivers that air, so your installation costs are going to vary greatly depending on whether you have access to add ducting, whether you have to use refrigerant lines, whether you're doing a retrofit or new construction, it's very difficult to understand.

Of course the sizing of the systems depends on whether you have insulation. If you're looking at an uninsulated three-decker, the best advice is to insulate that first and then see what your performance is after it's actually insulated. Then if you still want to add heat pumps, you can do that, and in the meantime you saved on your boiler or furnace, operating costs, and your carbon emissions and so on.

Of course, if you want to add in solar panels and factor in the fact that you can get free energy from the sunlight to drive the pumps, so that the heat pumps are going to be basically free to operate. You don't pay for natural gas. You don't pay for electricity, that's all well and good but the installation cost of the solar panels is another capital expenditure that you have to prepare for.

Installation costs gets very difficult to estimate. Prices of the systems are not disclosed on the NEEP heat pump list, so it's not easy for us to model so we haven't modeled it nor have we modeled maintenance costs. I’ve talked with landlords who have these installed in rental properties and in their own homes. The heat pumps can work wonderfully well, but they all have some kind of filter, and depending on the ambient dust whether you have carpet or so on those filters may need to be cleaned very frequently.

Under the Mass Sanitary Code, you know that landlords are responsible for maintaining the heating system, which means landlords have to clean those filters. If they need to be cleaned every couple of weeks and you've got to be in there to clean those, that's obviously not a good solution for rental property. It doesn't mean that you have to clean the filter every couple weeks. If you've got a low-dust environment and solid floors and the renters are amenable to doing the occasional vacuum or whatever is required to keep the things clean, then you might not have any maintenance at all.

[0:15:45]

One other thing that we're not modeling is with refrigerant. Anytime you have plumbing you have a chance for leak and if you're going with a ductless option, then you've got these refrigerant lines running everywhere and those fittings might leak over time. It might need to be replaced. You might have to deal with that, so that's something that we don't have a good handle on at this point in time.

Condensers might need to be replaced. If they use a nonstandard fitting size, you might have to replace the plumbing when you replace the condenser. They're working hard to standardize but not all systems are standard, and you might have to replace fan blades if you get an oscillation and stuff like that. We hope to model all these things in the future and provide this kind of guidance, but right now that's not where we're at.

One final disclaimer in terms of slides then we'll jump to the spreadsheet. I have a background in engineering and thermodynamics, but I’m not a licensed HVAC professional. I can't install heat pumps, so I’m not going to be able to answer some questions that are particular to the actual brass tacks of installing them. This is more of a high-level like is it even worth looking at. Are these things possibly going to be cheaper in the long term?

Right now the spreadsheet is limited to members. We try to provide an incentive for folks to join. Dues are priced to be affordable, so we hope that you will join to get access to the spreadsheet, but I’ll show it here as well and you could use the knowledge to make your own if you don't want to join.

I’ll stop that share and let me just start my primary share again here.

Let's look at this spreadsheet in detail. First, we're going to leave the comparison tab, which shows the main output here where we're looking at the gas costs versus the heat pump cost. This is the main output, and we're going to go all the way through each of the tabs just to give you a sense of what the lay of the land is and then we're going to go through the tabs in detail.

So first tab is a ReadMe where we have some general guidance. I’ll come back to this. Second tab, we track revisions so you can see how we've changed the spreadsheet most of these are internal. We released the spreadsheet at version 1.2. I’m sure after your feedback today we'll have a 1.3, and some additional models to look at.

We have a spreadsheet that models an apartment. As I mentioned just a simple box with height and depth of windows and so on. I’ll explain how all this works. We've got a very simple model of the gas equipment. Furnace or boiler treated the same basically it’s capacity in, efficiency out and then you get some numbers out.

We have a more complicated view of the heat pumps where we look at some BTUs out and kilowatts in and this table updates dynamically based on a set that you select from. Remember, I showed you this menu over here. You can pick different options. That heat pump table is populated based on the menu selection. I’ll explain this. I’ll explain this heating degree days spreadsheet this is the core of the model that looks at all these different days, what the temperatures are like outside, or have been like and how many heat pumps you need to run, and how much does it draw and what output does it produce.

We have a similar spreadsheet for cooling degree days, although there's almost no cooling to be done in New England, in Massachusetts. It’s just a little bit in the summer, assuming that 70 degree set-point and the comparison tab shows that. Again we're not accurately predicting the total cost of air conditioning because depending on your set-point and how often you run it, if you run it all night long, if your house got very hot because you had a lot of solar penetration in the windows and so on, your air conditioning costs will be higher. But the point is, they're not of the same order of magnitude as the heating costs, so you shouldn't get bogged down in the cooling performance of a heat pump.

If you're looking to heat a unit, the most important thing is focus on the heating performance and kind of you could assume that the cooling will work out.

Those of you familiar with Excel will understand this registry tab. This is the validation if you're going to list an item in this heat pump menu here it has to be listed on that registry tab, and then that registry tab essentially registers a heat pump model. The heat pump here, the Daikin DZ20VC, has different set-points for heating and cooling performance and this is an input.

[0:20:20]

I’ll point out here that we use Excel defaults, so if you look at cell styles, it might not be pretty but anything that's orange is an input value so you're expected to add in the design points based on the NEEP list. I’ll show you that in a second, and it's similar for all these. We've got all these different heat pump models outlined here and that's all there is to the end. If you look down at the bottom here, that's all there is to the end of the spreadsheet tool. It just goes straight through to the last one and you can add your own and then so you duplicate this worksheet, type in the new performance factors, register it, and then it automatically appears for selection on the comparison sheet. That's the lay of the land.

Let's go through in detail. We've got a ReadMe here, and we've got a couple of features of this spreadsheet. We've got some buttons that you can click, so if you open the spreadsheet and you're like you know I really don't know enough about Excel to make this work for me, that's fine. You're in good company. That's why the first button in the worksheet is to take you to the Microsoft training for Excel. In general, Excel is so useful for understanding whether your property is going to cash flow, whether it's worth having, keeping, or buying, so I really encourage you to learn Excel not just for the sake of this tool but just in general.

Now on this ReadMe page we've got some guidance about how to use the spreadsheet. I’ll skip that because that's what this webinar is about. I will focus on limitations you have to know Excel.

We're using 2019 actual weather as recorded at the Worcester Regional Airport. Now that's actually near the geographic center of Massachusetts, so it's useful but it's not exactly your microclimate. You might be in the Berkshires. You might be in the Cape and Islands. Your weather's going to be pretty different from what Worcester experiences, so you can go and get your own heating degrees data and load that in if you're looking at a particular property.

We're comparing heating only. As I mentioned we do produce an estimate of the cooling capacity, but we don't really compare it for furnaces or boilers run by natural gas. Although it is sometimes common to see those systems coupled with an air conditioner, often the air conditioner is an electric system that's built into the ductwork and that feeds outside so it seems like you have air conditioning but you're not using the natural gas to get the air conditioning if that makes sense. It is possible to use natural gas to run a refrigerant cycle, but it's very rarely done, so we're not comparing cooling. It’s not at all significant compared to the heating that we have in New England here.

Remember the first rule of using any kind of model or computer system garbage in garbage out, so if you put in invalid numbers or stuff that doesn't make sense, you're not going to get a useful comparison. Make sure what you're entering is accurate and of course this should go without saying but before you make any kind of decision to purchase, talk with someone who's licensed to do this who can see your property who can walk around and knows things like you know what because we've got a heat pump flowing and we get a head flowing air in this direction you're not going to reach around that corner to heat the space. We need a second here, so there's a lot of complexity compared to our modeling just a rectangle.

As I mentioned, we're not modeling the cost of capital to install. Retrofits are different from new construction and whether you pick ductless or ducted matter a great deal in terms of the total cost and we're not looking at variations in gas electricity prices. I’ll come to that in a second, but we're just putting in a fixed price, so if the price changes a lot we'll have to update the tool.

We do license these materials under the Creative Commons License, so you can share this but again we'd like to keep an incentive for there to be memberships so please do join to download the spreadsheet.

Now as I mentioned in the revisions tab, most of what we've done prior to this release was internal. We're going to have a new revision and when we do, we will add descriptions of what it is so you can see you know if you base some old work on a version 1.2 of the spreadsheet or 1-2, you can know whether you need to update or want to or not.

In terms of our apartment tab, this is the first real work for this spreadsheet here. As I mentioned we're modeling a unit as just a rectangle. It’s wide it's deep. It’s high it's got some window height and window width. It’s got door height and door width, so you can set the size of the apartment. This is a 20 wide by 50 deep that's a thousand square feet of space so obviously if your apartment's smaller model it as a smaller apartment, you might be able to get away with a smaller heat pump. We've got a height for the ceiling. We're not modeling any kind of temperature gradient you know hot air rises. We're just using that as the amount of wall height that we lose heat to the outside world through.

We model a count of windows. This apartment has a lot of windows in it perhaps. We model the width of the window and the height. These are very tall windows it's common in the late 19th century construction to have this many windows of these sizes, but obviously if you have a newer unit or whatever, you just want to walk around with a tape measure and make sure the model kind of reflects accurately.

[0:25:32]

Windows are not a primary heat loss. They're significant but not compared to the walls and ceiling and so on. We've got an ability to model doors not a primary heat loss because there's a few of them generally, but it's in there, and then we've got some insulation values that are pulled from a table below. So this is all orange. We expect you to type it in.

We've got a wall R-value. We've got an attic R-value. Clearly that attic is very highly insulated, a lot of blown-in cellulose probably up there. We got a floor R-value. We're using 40. I think this model assumes that you've kind of got conditioned space below, so obviously if you get a three-decker you've got three times as many apartments to heat and you need to adjust your model accordingly. This is looking at just one particular apartment, so for this one apartment do I replace the gas furnace or boiler here with a heat pump or not. We got R-values for the doors and windows.

These you type in based on what you look at down here, so these might not be totally accurate and you might want to update them but I think they're roughly right. If you've got ceiling fiberglass bat 12 inches, you've got an R-value of 37.2, so you could just put in 37.2 and that's equivalent to 12 inches of your of your bat there and similar for other kinds of doors and windows and so on. An old window has an R-value of two and energy star is four.

Note that we're using imperial units here. It’s just what we're familiar what we can find in the market. Obviously, it would be more clear to use a proper international system because you wouldn't have various factors involved, but using those R-values and the geometry, we can calculate roughly what the area is, what the R-value is for that whole surface and kind of roughly what the heat loss rate is. It you an idea, an estimate of it.

So you see in this apartment with the walls being less insulated than the attic that the walls are your major heat loss, so that's what you're heating to replace. Obviously, you can change all that and as a model, it's limited to the assumptions that you bake into it, but it gives you an idea. That's the apartment tab. That's what we have.

Now let's look at the first system tab, the gas. We're using the orange to indicate inputs you could type something in like this is the Maple Tree Lane number three boiler that I’m trying to model here, and I can put in the input capacity 80,000 BTUs per hour, and I can put in the efficiency. I’ve skipped over this. There's a lot of math happening on that heating degree tab, which I’ll get to but it's basically saying how much do you need. Given this apartment is pretty well insulated, how much you need to have your boiler produce and you can see here with an 80,000 BTU capacity a boiler or furnace, this particular well insulated apartment given the 2019 weather in Worcester only needed about 16, 000 BTU capacity to operate, so you have an excess capacity.

It's very common in gas systems boilers and furnaces and the reason for it is interesting. I have come to understand that a lot of these systems are oversized because they were designed to keep the place warm with the windows open especially following the Spanish Flu Pandemic of the 1910s, they wanted to have air ventilation and so especially these steam heat systems like what you see in high rises especially in New York, they were designed to be way overpowered so they could keep this place reasonably comfortable even with a lot of fresh air circulation because people were worried about contagion in ventilation, so funny how things history repeats.

We've got an efficiency metric. It’s an AFUE, annual fuel utilization efficiency, if it's a furnace. It’s in efficiency if it's a boiler. You can put in different numbers. You might have an old system and it's well worth replacing with heat pumps because it's very inefficient or you might have a new system and it's very efficient and it's going to be harder to make the case for heat pumps. You can put in whatever efficiency you want.

Given the input capacity, it uses the efficiency to calculate an output delivery. We take the cost of gas in terms of dollars per 1,000 cubic feet. We have a heat content for that gas in terms of BTUs per cubic feet. that gives us the cost for BTU and we also have an estimate of carbon emissions per cubic foot of gas input.

[0:30:00]

We tried to be very rigorous about all our sources. You can click this button here to learn about this annual fuel utilization efficiency. There's a nice Penn State website about it. We've also given sources for things like cost of gas, so for instance if you click this link here, it will pull up a history.

I think it should pull up a history. It could be because I’ve opened it recently I’ve broken it. There we go. Yes, now it's going to open three times because I was impatient and I clicked it many times.

But here you've got a cost of natural gas and you can see there's some variability. We're not modeling that. If you click the history here, you can see over time what the general trend is. We've picked an average point recently. You can see that natural gas has tended to get more expensive over time but it's been plateaued very much for a long time recently so it's pretty stable overall. That's that gas tab, pretty simple.

Now the air source tab is more complicated. We do have an average price of electricity. We're assuming a retail price. If you're operating at scale in a commercial building in an industrial building, obviously you want to update with your actual price and similarly we've provided a source for that as well so you can click the EIA page. It will show you different rates for electricity.

Never mind my reminder for good posture there.

You get uh graphs here as well. You can look at different things.

Where's the electricity graph that I had? It might be under this one.

The EIA generally has a lot of useful data. Yes, so here we go.

You can see electricity has tended to get more expensive over time. That's probably something you should factor in if you're designing a property for 10, 20, 30 years. You want to know that electricity prices do rise. It gives you more incentive to offset with solar, but then that also increases your capital costs and then the most important thing here we've got these design points. Heating for these different temperatures, cooling for these other temperatures, so heating at 5 Fahrenheit, heating at 17 Fahrenheit, heating at 47 Fahrenheit and how much heat can it produce.

Heat pumps generally are treated as variable speed. You can get some fixed speed one, but all the new efficient ones, they'll go from off to on at a min speed and then they can cycle up to max, so depending on how fast they rotate, how fast they circulate the fluids how fast they can heat up or cool an apartment.

So for instance this particular heat pump that's loaded in based on our comparison tab, the GE Endure Ash, etc., is designed at 5 Fahrenheit to produce at least 6,000 BTUs per hour for a cost of 1.56 kilowatts. It can spin up to fast max speed 36,000 BTUs per hour at a cost of 5.27 kilowatts. Those are the core inputs and they're specified on the GE Endure tab so if I go over to this here, that's the input. I’m got I’m just pulling it from this this particular row for that 5 Fahrenheit set-point.

You want to remember, if you're doing your own analysis we've got the link to the NEEP site right here. click here to find heat pump specs, so that loads up and it takes us right to this very powerful free resource from the Northeast Energy Efficiency Partnership. They might have a pop-up depending on how recently you visited the site asking you know what are you. You can say I’m an end user or consumer.

You can search by brand. There are a ton of brands. You can search by model if you want. You can search by ducting configuration. Remember I mentioned. you've got a ducted or ductless. You've got a choice of single zone or multizone where you've got multiple rooms heated by a single outside unit that would be multizone.

You can look at capacity. You just click search the list here without specifying any input and you'll see the tremendous breadth of options, 10, 883 heat pump models available.

Now a lot of these are going to be very redundant and similar, but some of them will be unique. You want to look for HSPF to be high, heating season performance factor. Like this this nine, this is really an air conditioner. That's not really very good. This one 15, that looks pretty good, and it's even branded. They're all branded to be very cold-rated Arctic next-gen by HAIEIR.

[0:35:00]

So you can see all this data we pulled up if I click view detail what we have in the spreadsheet that 5 Fahrenheit design point is exactly what we've got here. How many BTUs does it deliver on low speed at what cost in terms of kilowatts? Does it deliver at max speed? What cost at kilowatts? You just load that into your Excel tab and then that gets used in the model, so let's look at what the core of the model is. This is the most important tab in the whole thing.

Heating degree days, this data comes from degreedays.net. You can go to that site. I haven't made it a link I guess but you can go to that site and you can see how that works. You just select a weather station. It pulls based on the national weather service and also internationally. I know that the Worcester one is KORH, so I can get my own weather. Obviously, it's international. It does India and Thailand, etc. It’s just a great resource so you can click. KORH is the weather station I want. I want heat and degree days.

We're going to use a base temperature of 70 because that's where most people realistically keep their thermostat set at. You could obviously change, have any base temperature you want. It’s just going to calculate a delta, say daily based on the period covered. If you're going to look at a full calendar year you probably want to select more than just 12 months. You probably want to select something like 24 so you get the whole past year, and you click generate. It doesn't ask your email or anything like that. It’s just a pure public good site.

It will calculate the difference between the set-point and the temperature at various points during the day and give you an estimate for how cold that day was, and that output is going to look exactly like this – date and heating degree days and over time as much as you want we load data in daily, so for instance if you look at February this is 2019. you could update it to be 2020. February 19, 2019, 52.8 heating degree days. It’s a very cold day. It means compared to your set-point of 70 on average, you're 52.8 degrees colder than that outside the whole day compared with a day in July you wouldn't even think of heat being applicable here, but the way this works is if the outside temperature drops below the set-point at any point in time you get a little bit of a degree day difference. It’s cold that night, you get a 2.6 degree day account for that, not a lot obviously, so we've just left it all in exactly as calculated it applies to the furnace as well as the air source heat pump so it makes for a valid comparison even if you wouldn't have the furnace on or the heat pump on at that point in time. We're not predicting actual costs. We're just trying to compare the two, so that's fine.

There's a disclosure in the heating degree site. If they don't have real data they might do an estimate. Most of the data for National Weather Service Systems are not estimated, so estimation percent is zero, that's fine. Then we can calculate the heat loss, so this references the apartment sheet. It references how cold it is outside and it figures out okay how much heat do I need to provide each hour to keep that apartment at the set-point, which for this is 70 degrees.

Just for the sake of checking, we've got a report of the outside air temperature in Fahrenheit and then we've got some data pulled in for the particular design point that the heat pump's operating at, what's the assumed min kilowatt hours and the max kilowatt hour. So given that it's you know 32 degrees outside, what's the min power for this heat pump and what's the max power.

We're linearly interpolating between design points so if I look at the comparison tab for this heat pump here, you can see that this GE Endure which is expensive compared to natural gas is not so brilliant. This is this is optimized for 47 Fahrenheit, so that's not really a very cold climate optimized heat pump. Maybe this one was designed for Georgia or somewhere like that or San Francisco where it gets cold where you want to have heat in the winter to be comfortable, but you don't really need to worry about these really cold days, so obviously this is not the best model to look at, but for the sake of just illustration we can show why it's not the best and because its output, its ability to produce heat when it gets very cold it falls off.

When it's very cold outside there, we know what's the low speed, what's the max speed and then how much does it have to operate in order to keep that set-point. We can look at the number of units required to see if the total amount of heat is beyond the capacity of a single system. In this case only one is required but remember there was a Fujitsu that looked quite poor.

[0:40:00]

This one here if we go back to the heating degree days sheet here now, you can see there's some point where it's really cold and requires two systems, two compressors to operate so that's probably going to be in February of 2019 it was really cold.

Let's see if I can spot it here.

Yes, so this this particular day, February, or January 31st where the outside temperature was 1 Fahrenheit. Well obviously all right so if you want to design your system to be able to really provide that set-point and you're not okay with it sinking below that set-point and you're going to need two units for that. Given the number of units, you can figure out how many so you apply that to if that's the size for the year you apply that to the all-design points so you've got two units running and you've got a min setting, you get a max setting.

[0:40:48]

We assume by the way that these things do cycle off so they don't have to run continuously if they're not needed. If they've heated enough for the hour, then they can turn themselves off. That's revealed in the runtime percentage. That's the stat that you sometimes see used, so a single compressor would have to run 125 percent of the time, that means you need two compressors there. If it only needs to run you know 40 percent of the time it means it's off for 60 percent of the time.

All of those daily calculations for how much heat is required and how much electricity it costs produce your total heat loss in BTU, which is used to evaluate the furnace as well as the heat pump and kilowatt hours especially in terms of the heat pump right there.

We do a similar comparison for cooling degree days just for the sake of illustration, but it's not really material. There's so little cooling to be done compared to heating that your design point should really be about heating.

All that leads to the comparison tab, which we're now ready to understand in detail. So we know what our input requirement is for the furnace because we know how much heat loss for the apartment is and we know the efficiency, so we have to input more than we actually need because we're going to send a lot of the heat up the, chimney 20 percent of it. In terms of the BTU dollars for BTU costs it gets turned into an annual cost for the furnace and you can see kind of what the cost per thousand BTU delivered is. That's a statistic that's used commonly out on the web for looking at different systems.

You can also see the carbon dioxide emissions per year. Now note even if you go to 100 efficient furnace or boiler, you're never going to eliminate the carbon dioxide emissions because that efficiency is not about whether you need to burn gas at all. It’s about how much goes up the chimney and because you need to burn gas in order to keep the base heat, you're always going to have carbon emissions with the system that's powered by gas.

Compared to an air source heat pump, it depends on where you get your electricity from. If you get your electricity from a coal plant you definitely have carbon emissions there but I can't model that because I don't know where the heat pump electricity is from and obviously if you choose to have a green energy supply or renewable supply on your electric bill or you install solar panels, then your carbon emissions will be limited in the case of a heat pump to just the cost of manufacturing those and delivering and installing because they'll ride on fossil fuel power trucks likely and so on. That same logic applies to the furnace. Again we're not trying to calculate your actual carbon costs here but we're just trying to compare, so air source heat pumps have the potential to be zero carbon.

Now given all those heating degree days, we can see basically the summary of the design points. We can see how many kilowatt hours you need. That's very useful because solar panel systems are designed specked in terms of how many kilowatt hours they produce over the course of a year, so that'll tell you right away whether your solar panel system can power your heat pumps or not.

Obviously, the Fujitsu is a terrible brand to consider. It requires a lot of power. It needs two condensers you get twice the capital outlet cost. It’s going to be hugely expensive to operate. Let's not look at that because it'll be depressing. Let's look at the other Fujitsu. This one's cheaper, right? It requires very few kilowatt hours to operate because it's designed to produce a lot of heat output at its peak point. It’s not optimized for cold so it might not be the best one to buy.

We're making no particular recommendation on that brand or model, but it's powerful and you can see based on the runtime percentage that because it's powerful it never needs to exceed more than 50 percent running, so it's off basically half the time even on the coldest day of the year, so that's a good candidate. It’s efficient enough where it's going to be cheaper than gas.

As I mentioned, we can register a new model so the easy way to hack it and I’ve saved a separate file here so I’m not changing the official version but the easy way to hack it is just type in different numbers here from whatever other heat pump you want. You could just do whatever the NEEP website says, and then you can leave the name and know that it's really a different thing or you can just rename the spreadsheet and call it you know version two or something, and then you can register that again on this tab here and call this one version two and then you've got that option immediately registered in the spreadsheet here, version two, so you can model.

[0:45:12]

It’s broken because I’ve failed to update something. I wasn't prepared to demonstrate here but the point is basically it's not impossible to modify the spreadsheet, and clearly if this is happening, then we're going to release a version 1-3. That'll make it easier for you to customize this. Obviously, we want you to load in your own HVAC recommendations so there's something. We've been doing pretty good so far to have the demo work, so far so good without any of that, but anyways it's Excel. It’s not perfect. The idea is it's a tool that you can learn to use and get some guidance on.

Questions and Answers

All right now to date because I’ve been doing the screen share it's not been easy for me to see the Q&A, so I’ll just look at some comments here.

So Meg says, “I think you showed the AOU18RLXFZH very poor heating performance, but I think the unit has strong heating performance.”

So let's investigate that claim. Where was the AOU, this Fujitsu one here. Yes, I’m going to click the link that Meg has shared to the NEEP website. We're going to look for that particular product and see what it says if it will load.

Okay so we're looking at, so here this is important to point out, so the one that I’ve kind of pooh-poohed, the Fujitsu Halcyon Multi-Room Mini Split Systems. It is a heat pump. It will deliver heat. As I mentioned it's not particularly powerful. What can be misleading is it has a very high seasonal energy efficiency rating, SEER. The SEER applies to cooling and what you need to look at for heating season performance is the HSPF and 9 is not a very high number compared to we saw that higher system had a 15. So it's very good for cooling and I’m sure it's been optimized for that design point, but for heating it just doesn't work so well.

And so that's part of the reason for this spreadsheet is to really model it because these numbers are designed to represent uh some specific cold design point or warm design point, and so first of all it's important to understand what the numbers really represent, whether they're talking about heating or cooling. Second of all, it's important to see how they actually fare. It’s very possible and I’ve talked to landlords recently who have heat pump systems that can't keep up when it gets to be 15 Fahrenheit outside and they said well I’ve got a cold rated heat pump why is why isn't it working, and the answer is because it's not working well enough. It is delivering heat, but it's not enough to keep the apartment at the set point.

I think I’ll stand by the model's prediction that this particular model, although it seems to be it advertises and it looks like it's hot rated, the overall efficiency for that Worcester weather does not compare favorably to a gas furnace. I hope that will make sense to people just because you do run the risk when you switch to heat pumps that your gas equipment is going to be something that you desperately miss.

Yes. “How does the apartment calculation relate to the spreadsheet heat loss of 15,612? What units are shown in the apartment heat loss?”

Apartment heat loss will be BTUs per hour, so if I go back to this here, this is BTUs per hour per degree Fahrenheit, in particular so that's a small number 216 there and then when you go to the heat degree days I should point out that will probably have a variable name associated with it. If I go to where will I see formulas or names.

Oops! I’ve got a break timer here remind me I’ve been on the computer for too long. I’ll turn this off.

This will have a formula heat loss for delta T that's referenced inside the heating degrees days sheet, so we're looking at the delta and the apartment has a certain heat loss in terms of delta temperature so that's going to calculate the total loss per hour for that day so I hope that makes sense given 24 hours in a day.

It looks like SJ points out that data for the Fujitsu is incorrect at 5 Fahrenheit on the spreadsheet. Minus 15 Fahrenheit data has been inserted rather than 5 Fahrenheit data.

That could be. It's always possible we made a typo. Let me just take a look at that, so yes, if we've if you've pulled up the actual NEEP website, which I won't be able to do quickly because I haven't got a link here, there's apparently an error in this and that's expected. I apologize for that. We do want to get that typo corrected, so if you could just send a link to hello@MassLandlords.net, SJ, and let us know.

We'll update that data but I think broad strokes what I’m looking at here, maybe that Fujitsu is the wrong one. Remember I did type over some of these things earlier for the sake of showing a change there.

[0:50:45]

Leo asks, “Do you have a recommendation for a heat pump that can be used as a sole source of heat for Boston winters?”

I mean no I don't have one particular make or model designed. We've purposely steered away from saying this one's really good. The point of the tool is to go in and understand how it works evaluate it yourself. I will point out that in the default set of things we have loaded here, there are a number of heat pumps that are outside a margin of error in terms of their performance and that's actually the picture we used originally.

The Trane Mitsubishi this particular model has a very high heating season performance factor of 15. Anything with an HSPF of 15 or similar is going to tend to be a good option and it's going to depend entirely on what the installer is comfortable working with, whether you can retrofit it into your unit, how many heads you're going to need given the size of your unit and configuration of doors and everything, so that's what we're talking about in terms of not modeling the install cost. Very difficult actually to know what it would really cost you and some of these if you just go in and say I want heat pumps and I want you to heat this place it could cost you an arm and a leg because of the configuration, so that's a difficult question to answer.

All right so, John asks, “Your default example shows only about $120 annual cost savings between gas and heat pump looking operating costs. Is that a realistic example? Am I reading that right? I was expecting to see something more significant, given the install cost of a heat pump?”

John, you've hit the nail on the head there. I mean we're not trying to say that heat pumps are bad, but the heat pumps need to be approached very carefully because you could easily buy electricity off the grid without having your own solar panels. You paid a lot for this capital. The refrigerant lines are going to need to be replaced in 10 years and that's not a comparison that's favorable to a gas system.

You buy a gas furnace, a gas furnace, or a boiler, you'd expect it to last 30 years. You're going to have to do almost no plumbing with the hydronics assuming you don't have a freeze up and it keeps running the forced hot water baseboards or the furnace keeps working. It’s not a slam dunk to just say yes heat pumps are the be all end all and the savings margins can be quite slim depending on whether you configure them with solar panels and how many units you have installed and what the individual set-points are.

Now one thing that's again worth pointing out in the context of the comparison is that you can turn off rooms with a heat pump that you cannot do with a furnace or boiler, so if the family is concentrated in the kitchen during some hours in the dining room or the other and the bedrooms aren't used, you can run those right down to a low set-point and so that's a real level of control that will improve the outlook for heat pumps a lot that's not modeled here. In fact, you can just turn off a third of the apartment. But the point is yes, John you're right, you've got to be careful with how you approach this decision.

Steven asked, “Some heat pump models seem to put out less heat as the outdoor temperature increases. Would be interested in the science behind that.”

That's interesting. Do I have an off-the-cuff explanation for that? I’m not sure, Steven. If I find out, I will let you know.

Eric asks, “How about heat pumps for hydronic heat? Is that a good option? I do not hear much of it yet.”

Yes, Eric, I would love to retrofit for instance my own home with a hydronic heat pump. For those who don't know what that is, you have the heat pump working but instead of running refrigerant lines all around the house, you run them into where your boiler currently is and instead of changing anything in the unit, no splits or anything inside you just heat up the forced hot water pipes. You obviously can't do cooling that way because if you run cold water through the pipes you'll get condensation which will rot out your walls and create mold and everything, but you can run hot water that way.

[0:55:00]

Here's the rub with heat pumps for hydronic heat. If you look at the maximum output temperature, these heat pumps tend to only produce a maximum output temperature of 120 Fahrenheit. A boiler with hydronic heating will tend to produce a max output temperature of 180 Fahrenheit, which is why when you get up on a cold morning and it's 10 Fahrenheit outside you can turn the heat up and it will be up to temperature in an hour or two because it's running very hot water through those pipes. But with a heat pump system, hydronic heat pumps you have to first verify that 120 Fahrenheit water is enough to keep the apartment at a set-point because it might be that it can't even run continuously. It doesn't deal too well. It can't get up to a set-point, so that's I think a mystery.

Now that I’ll point out one more thing to look into and maybe if you find out you can let me know. If you have a heat pump, the performance the output temperature is set by the difference between the source of the heat and the output, so you're getting 120 output on a heat pump because you're kind of assuming you've got to pull air from outside when it's 5 Fahrenheit. Geothermal potentially offers a different way to approach that because you've got a constant 50 Fahrenheit ground temperature, so that same delta, that same max performance might be able to get you up to the temperature needed for hydronic heating system and that's I think that would be very cutting edge if there's one out there. People tend not to look at geothermal at all, but that's what I’d like to learn more about.

So a way to test it if you have a boiler that will let you output your hydronic temperature and change it you can change that down to 120, run that for a season and see if that keeps places at set-point and that's comfortable and if that's true then you're an immediate candidate for a heat pump with hydronic retrofit and you don't even have to go into the units. That's a long answer to your question I hope that's helpful.

SJ, I see you've tried to clarify where we have the typo but given that we're live here in the webinar I’m not readily able to look at where that is, so I’m just going to copy your questions and make a note here to follow up with you afterwards because obviously no one is perfect and this spreadsheet is not going to be perfect, so we just want to try to get all feedback. If you see other things that are wrong, please do let us know.

Bill asks, “From your experience how would you broadly assess the degree of impact of all the data detail on windows, doors, etc., on the performance and ultimate cost-comparison. For instance, would it generally be true that if you have a heat pump unit that is rated efficient for the reason, wouldn't that be the choice irrespective of construction details?”

Yes, that that might be a fair point, but I really think it's going to come down to the layout like there are some so the way these especially if you have a ductless option and it's blowing air, you can only blow in one direction. You can't blow around corners. You can't blow through closed doors, so you tend to get bogged down into the install costs right away.

“How many heads do I need inside the units? Even if I found one multizone that's efficient, is it really the best thing to have that one system installed on one part of the house and run these plumbing lines all the way around or would it be better to have two systems located at different parts of the property that feed in and they each they come at it from one side or the other?”

So again I’m not a licensed HVAC installer, but my understanding is that there's a lot of complexity there and you're not going to find the one true system to install without talking to someone who can actually look at the space, so I hope that's helpful, Bill.

All right, it is 1 o'clock so we'll end there. My commitment to everybody who's here, if you have follow-up questions especially if you want to poke holes in the spreadsheet or show us where we've done something wrong, we need to hear that we want to hear that. Email us hello@masslandlords.net. We read everything we can make an updated version to fix any typos and data or we've had that ref error appear when I tried to rename the thing so we'll get that updated.

Then please do make sure you're looking at the best options for retrofit and so on because I think there's a there's a lot to gain from understanding this new technology and I don't want to see anyone make a mistake by replacing what's a perfectly serviceable gas system with something that wouldn't be able to keep up. On the other hand, I would like to see everybody move to carbon neutral devices provided that they're going to work and be low maintenance and help us to do our jobs as landlords, so we'll end there. Email hello@masslandlords.net follow up.

Thank you all take care and stay safe.

[End 1:00:09]

Click here to watch the latest MassLandlords Business Update.
This is part of our Statewide Rental Real Estate Networking and Training series.

Get Access to this Spreadsheet Calculator.

Become a member today.

Explore Membership Options

21 Responses to Heat Pump vs Furnace Calculator for Natural Gas Replacement

  1. Stephen G says:

    Great too! Can you double check the rating for the Fujitsu heat pump at 5 F? You have it listed at 12,000 BTU/hr which appears to be the rating at minus 15 F?

    What is the calculated heat load for the apartment, a 80,000 BTU/hr. boiler may be over double the size that is needed? I could not determine what size boiler or heat pump is required for the typical 1,000 sq. ft. apartment shown from the spread sheet?

    Do not fully understand the comparison of the Fujitsu and Trane heat pump, they are different sizes? The Trane is approximately triple the size of the Fujitsu and may be oversized for the apartment?

  2. Gary W says:

    Doug great job the other day, even taking live “hits” on the sheet, impressive.

    As an HVAC installer I rolled with a few minor glitches in the explanation, but you did an excellent presentation.

    Stephen you probably can double check all this yourself, not sure Doug wants to be the gateway for such matters
    https://ashp.neep.org/#!/

  3. Gary W says:

    It may be good to have another page on the sheet that lets you ‘back in’ to your millions of BTU per year. Example- if you know how many gal of oil you used, a sheet could quickly extrapolate the total BTU. That would perhaps be more accurate than attempting a heat loss calc, which has number or variables that are difficult to be accurate with (actual R values, U factors, Infiltration rate, set point on the thermostat, etc)

  4. Gary W says:

    Stephen, allow me– The sheet is just a numbers cruncher, not meant to take the place of a skilled hvac installer. As you aptly point out: Yes, the 80,000 BTU is WAY too big for a 1000 sq ft unit. I think Doug was trying to point out the virtues of the dollar comparisons, and looking at the HSPF on different units.

    As with all things trades related, be mindful that the cheap guy could be more expensive that the non-cheap guy, that fact has been proven over and over again since the beginning of time

    ALL– be careful when yanking the central systems, very aggressive move. If the unit poops out in mid winter, repair efforts are simply not as fast as central systems. And, be careful with bathrooms, you may need to stick some elec heat in there.

  5. Kopernikas Green says:

    ike the helpful information you provide in your articles. I will bookmark your weblog and check again here frequently. I am quite sure Ill learn lots of new stuff right here! Best of luck for the next!

  6. Stephen G says:

    Gary W.
    Gary I agree with your points and it was an excellent presentation. The point I was trying to make is that the Fujitsu model #AOU18RLX FZH is listed with a capacity 12,000 BTU/hr. at 5 F on Doug’s spreadsheet while the information on the NEEP Cold Climate Air Source Heat Pump list and the manufacturer’s website shows the unit is rated for 22,000 BTU/hr. and I have first hand knowledge that the unit can produce 90 F discharge air on a 5 F day or over a 20 F rise which was enough to heat a 1,000 square foot apartment. This was installed as an experiment during a remodel of an apartment I moved into with the primary purpose being AC. In summary I would never remove the fairly new gas cast iron boiler and baseboard heat and rely on an air source heat pump although it does work and I will probably use it for comfort heating during the shoulder seasons as it is less expensive to operate but both systems have similar operating costs during the cold winter weather. Correct that my bathroom is not served by the heat pump.

  7. Green Leaf Air Dallas says:

    I like the helpful information you provide in your articles. I will bookmark your weblog and check again here frequently. I am quite sure Ill learn lots of new stuff right here! Best of luck for the next!

  8. Clover Rayner says:

    A heat pump works on a different thermodynamic principle: It draws heat from the outdoors (even if it’s cold outside) and transfers that heat to your home’s interior. So while a heat pump will not generate heat, it is able to absorb heat via pressurized refrigerant lines and then release that heat into your home.

    • Jillian Campayno says:

      Hi Ed, this file is available for MassLandlords members. Please email us if you have an account under a different email address.

  9. Tyrone Loukas says:

    Explained the intricacies of HVAC systems beautifully, making it easy for readers to understand the importance of proper heating, ventilation, and air conditioning for optimal indoor comfort and air quality. Kudos to the writer for breaking down complex concepts into digestible information

  10. Sanders says:

    Thank you for this insightful article. While the primary focus of this article is on heating systems, I’d like to add a few points related to air conditioning and home cooling.

    Air source heat pumps are not only efficient heating solutions but also highly versatile for cooling your home. This dual functionality is not only convenient but also cost-effective, as it eliminates the need for a separate cooling system. Moreover, air source heat pumps can provide consistent and comfortable cooling throughout your home. They offer better humidity control compared to some traditional air conditioning systems, ensuring a more pleasant indoor environment.

Leave a Reply

Your email address will not be published. Required fields are marked *

Advertisement

Advertisement

Advertisement

Advertisement