Weekly Housing Court Eviction Data Published by MassLandlords
| . Posted in News - 0 Comments
By Eric Weld, MassLandlords, Inc.
Predictions of an “eviction tsunami” in Massachusetts following the expiration of the state eviction moratorium in October have flooded media reports since early June. But data recently published by MassLandlords and the Massachusetts Trial Court show eviction case filings for the eight weeks ending December 12, 2020, were significantly lower than or no different from the pre-pandemic housing crisis baseline.
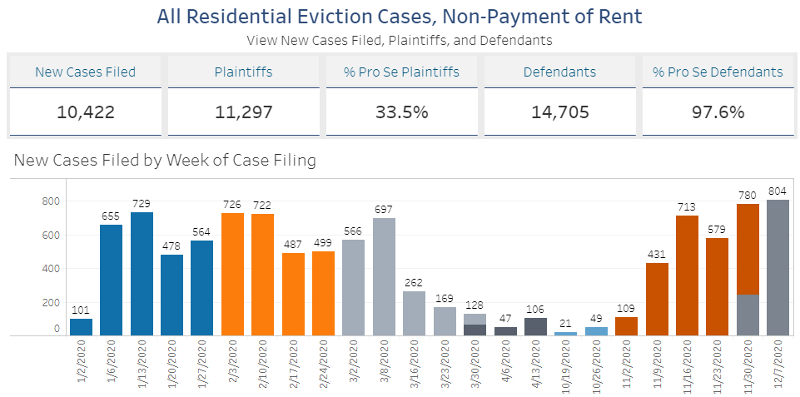
Data from the Trial Court show no tsunami of evictions when the state moratorium lifted (eight bars from the right).
MassLandlords has begun publishing weekly reports of data compiled from housing court statistics, starting with the week ending October 24, the first week of court business after the state eviction moratorium expired. The state moratorium officially ended on October 17, but effectively ended Monday, October 19, at 9 a.m., with the opening of courts.
The MassLandlords reports go beyond what is published by the Trial Courts themselves. We offer breakdowns according to court districts, counties and municipalities, insight on representation, and attribution by cause.
Eviction Tsunami? Not according to early data
Several notable findings have emerged from data in early reports.
One general but important – and cautiously positive – finding is that the overall number of early eviction filings has fallen short of the “tsunami” widely predicted. For example, the total number of evictions filed in housing courts in the first three weeks shows a weekly average well below that of eviction cases filed before the pandemic. This conclusion is drawn by comparing our recently published data against a control analysis of data from April 2019, a full year before the State of Emergency, pandemic lockdowns and housing court closures.
Eviction filings in the week after the lifting of the state eviction moratorium, ending October 24 (49), plus the total for the following week, ending October 31 (95), totaled 144, an average of 72 housing court filings per week. Comparatively, eviction filings in the entire month of April 2019 totaled 2,298, a weekly average of about 534 per week.
It should be noted that notice period delays would result in the first few weeks being lower than expected. But even since notices have expired, filings have been no higher than before the pandemic. A federal eviction moratorium, instituted by the Centers for Disease Control and Prevention (CDC), has remained in place through December 31, 2020. The federal moratorium restricts some eviction cases from proceeding for renters who have been affected by the coronavirus pandemic and economic slump. It’s possible the CDC moratorium could be dampening, or delaying, the number of evictions filed. January reports may help clarify that possibility.
Two more notable findings
Two other important findings have emerged from data in early reports:
1.) After the state eviction moratorium expired, initial eviction filings did not impact classically urban areas the hardest, as might have been expected. Rather, statistically significant numbers of evictions were filed in rural and vacation areas, such as Cape Cod, the Islands, and small towns.
Considering the relatively sparse populations of some of these communities, eviction filings are out of proportion to the renter populations in those areas when contrasted with eviction filings in urban areas.
The MassLandlords reports present the statistics as a proportion of the municipality’s population, as published in the 2010 U.S. Census. In order to present an equitable contrast in percentages among Massachusetts communities, the reports measure eviction filings as a rate per 100,000 residents. In Topsfield, for example, a town in Essex County of some 6,000 residents, one eviction filing equals a rate of 16 per 100,000. In South Boston, a neighborhood of more than 33,000 residents, one eviction measures as 2 per 100,000, a much lower percentage.
2.) The leading reason for eviction filings in the first week after the moratorium expired was not nonpayment, as might have been predicted amid the economic slump caused by the coronavirus pandemic. Rather, lease violations were the leading cause of eviction filings in the first week.
Let’s look closer at these findings.
1.) Top of the list: Cape Cod, Martha’s Vineyard
Several relatively small communities top the list of eviction filings in the first two weeks’ reports, on a proportional basis. Vineyard Haven, a village on Martha’s Vineyard, and Osterville and East Falmouth, both in Barnstable County on the Cape, each had one eviction filed in the first week after the moratorium was lifted.
While the single eviction in each community may seem insignificant at first, each stands out in proportion to the towns’ populations. Vineyard Haven’s one eviction filing represents 52 per 100,000; Osterville, 28 per 100,000; and East Falmouth, 17 per 100,000.
The second week’s report ranks the rural towns of Baldwinville (Worcester County, population: 2,028), Sherborn (Middlesex County, population: 4,119), and the Cape Cod communities of Provincetown (population: 2,994) and Eastham (population: 4,956) atop the list of eviction filings per 100,000 residents.
Larger, urban areas, like Worcester, Pittsfield, Chicopee and Springfield, are represented lower on the proportional list. (Municipalities with no eviction filings are not shown on the reports.)
A ranking of county statistics places Dukes County, which contains Martha’s Vineyard and 10 other islands, atop the list of eviction filings proportionally, in the first week, followed by Plymouth, Berkshire, Essex and Barnstable counties. These are not as heavily urbanized as Suffolk, Middlesex, Worcester, and Hampden, which do not top the list. The second week ranks Barnstable County first with seven eviction filings, representing 36 per 100,000 residents; followed by Plymouth, Worcester and Berkshire counties. With the exception of Worcester, the cases brought soonest after the state moratorium lifted were suburban and vacation region cases.
2) Leading reason for evictions: lease violations
Considering much of media reporting throughout 2020, warning of an oncoming eviction tsunami, it might be assumed that eviction filings would be mostly due to rent nonpayment. But in the first week following expiration of the state eviction moratorium, rent nonpayment (18 cases, 36.7 percent) is only the second-leading reason for initiating summary process case filings. Non-payment filings are surpassed by for-cause, or lease violations (21 cases, 42.9 percent).
Data from the second week’s report, ending October 31, shows nonpayment (34 cases, 35.8 percent) regaining the lead spot on the list of eviction reasons. Lease violations (30 cases, 31.6 percent) are second on the list. (Other reasons for eviction filings are no-cause-stated, foreclosure, and “other.”)
Although nonpayment has since returned as the primary cause of evictions, same as in the April 2019 baseline, initially the most urgent cases blocked by the state moratorium may have been behavioral and/or other lease violations.
Attorney representation in housing court
Also included on the weekly MassLandlords data reports are percentages of attorney representation among plaintiffs (landlords) and defendants (tenants) in eviction cases that come before the court.
As would be expected, the data shows that attorney representation is disproportionately higher among plaintiffs in eviction court cases. What our reports show (which Trial Court reports do not) is that most filings are driven by corporations. This largely explains the discrepancy in representation: for corporations, attorney representation is legally mandated. When considering unincorporated housing providers, consistently more than half choose not to hire an attorney.
Among defendants in eviction cases, for whom legal representation is optional, about 10 percent procure attorney representation, while about 90 percent appear before the court pro se (self-defending).
Weekly data source
The MassLandlords eviction filing reports will be published weekly, always in the week following the data period represented.
We will also produce eviction outcomes reports that present statistics for cases that resolve through mediation, those that may end in forced move-outs, and other court outcomes.
We hope these reports will serve as valuable and timely resources in support of accurate reporting of trends in the state’s housing crisis, both as a result of the pandemic and ongoing. View the data for yourself: Week 1 report (ending October 24); Week 2 report (ending October 31). Week 3 report (ending November 7).