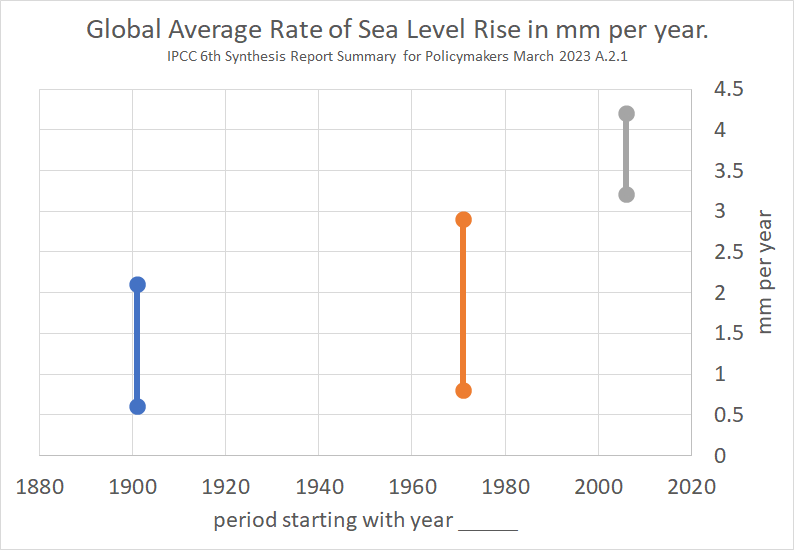
sea level rising – image 3 – IPCC 6th Synthesis Report Summary – editorial use IPCC Climate Change 2023 A-2-1
. - 0 Comments
Better Communities. Better Policy. Better Lives.
The largest non-profit for owners and managers of Massachusetts residential real estate.
. - 0 Comments
Advertisement

For Members
Advertisement
Advertisement

Advertisement