Rent vs Buy Calculator
Our rent vs buy calculator is broken into four worksheets, three of which you can ignore:
- "revisions," which gives us a reference for this spreadsheet's long history;
- "verification," which lets us check that the macros work
- "case_list", which creates the drop-down in the graphing assistant, and
- "template", which is where you'll do all the work.
The Basic Structure of this Rent vs Buy Calculator
The "template" worksheet has a narrow header region, six columns of scenario calculations, and a graphing region.
Header
The header section lets you identify the property being analyzed. If you're currently renting, you'll want to evaluate lots of properties to find one that meets the criteria you're looking for. This section lets you keep it all straight.
You can also benchmark this property against others by quickly noting units, square footage, and asking price.
Scenario Calculations
The six scenario columns are preset to help you analyze worst case, expected case, and best case scenarios for "fully rented" and "owner occupied" strategies (3 x 2 = 6).
In each column is a basic profit and loss statement to help you evaluate whether you should continue renting wherever you are or buy this property being analyzed.
Income
At the top of the profit and loss is your revenue. This is primarily unit rents, although we left you space for "Other" income, which might include laundry, solar panels, or additional units.
Expenses
Below this is your expenses. Take a good look at this list! You're probably forgetting something. We sprinkled in some "Miscellaneous" items for you to add your own expenses. The default numbers under the "expected" column, column D, are roughly correct for a three unit in Worcester. Cambridge tends to be three times as expensive. Fall River may be half as expensive. You'll need to look at where the property is.
Mouse over the column B cells to read the notes, which describe the justification for some of these default expenses.
Further down the list you enter the "Financing" sections. Here there's a little bit of control over negotiation. You can adjust your bid offer as a percent of the seller's "ask" price. You can adjust how much to put down, what you think the closing fees will be, and whether you already know you'll be making an up-front cash investment for repairs and rehab.
We programmed in the ability to have first and second mortgages, although probably you will find it easier to get a loan with a single "first mortgage".
Profitability
We analyze profitability in all the cells below "Net cash /mo". This should be positive or close to it for all scenarios.
You'll want to enter the formula for "initial net after tax/mo" to adjust your marginal rate away from 25% if that's not a good starting place for you. (Look for that in version 33, row 67.)
You can also set a target year. In many situations, your investment will be unprofitable to start, with up-front repairs and high interest payments. Over time, this will improve. The default in this worksheet is to look out 20 years.
At that "20 year time horizon," we calculate a variety of totals for you, including "total interest paid," how much more wealth you'll create for yourself ("change in net equity before cap gain"), and the present value of that opportunity to make money ("PV of equity before cap gain").
Capital Gains
Capital gains on a rental property are properly considered gravy. They should not be a fundamental part of your analysis. In fact, we feel so strongly about this that an earlier version left out capital gains entirely. (Just look at what happened in the 2008 housing crash.)
But, since it can make a big difference to your outcome, we included the ability to model a yearly capital gain. We recommend against buying a property unless your "annualized ROI" is positive when "capital gain per year" is zero. Otherwise you're not really being a landlord, you're being a house flipper.
Renter Savings
The final portion of the worksheet is where you can enter how much rent you're avoiding by buying the place. If you're not going to live in it, you avoid zero rent (you still keep paying rent where you are). If you're going to live in a unit by yourself, your "rent avoided" should be your current rent. Remember to remove the rent from the revenue line for the apartment you're going to live in.
If you're bringing on paying roommates, you can leave some revenue for the apartment where you'll live. It will smaller than market rent by the amount you should contribute as your fair share, right?
"Capitalization rate" is the last input. You could also call it, "How much would you make in alternative investments if you didn't buy a rental property?" We put in 10%, but most folks looking at generic stock market stuff should expect only a 4% return after taxes and inflation. (Remember that as a landlord, your rents will keep pace with inflation, more or less.)
Using the Graph
The graph lets you plot three scenarios at a time. In the cell labeled "Case", pick the column header corresponding to the scenario you want. (Note: if you renamed your column headers in row 6, you will need to edit the "case_list" worksheet to make this menu line up.)
When you've selected the right scenario, click "ROI Plot". Assuming you enabled macros, it will generate two curves for you:
- the blue curve is your return on investment
- the green curve is your increase in net worth because you became a landlord
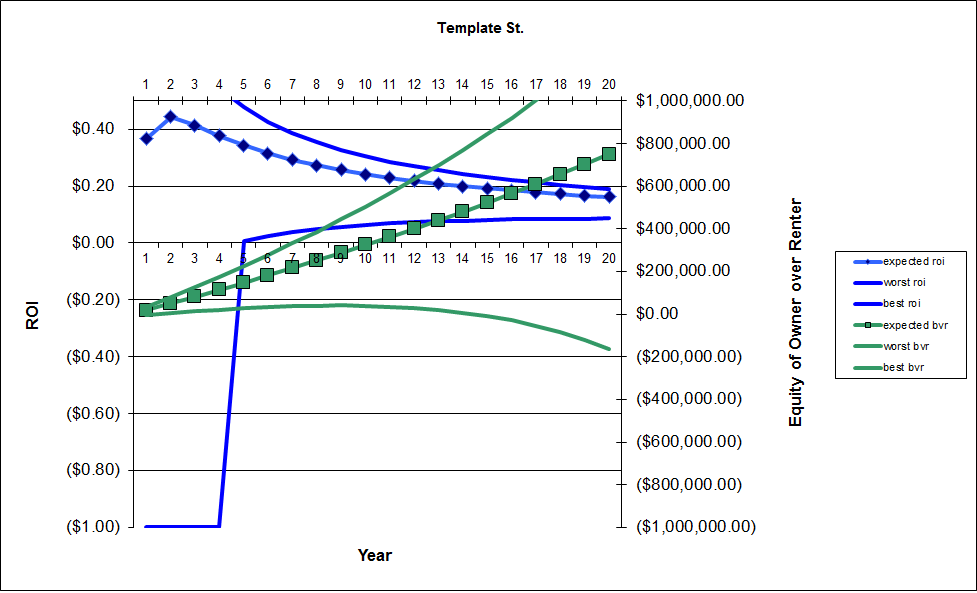
Either of these can go negative. The blue line will sag over time as you pay off principal and your investment in the property increases. If the green line sags over time, especially if it heads down and to the right, that means you're better of renting!
The x-axis in this plot is the year after you purchase.
By plotting "expected," "best," and "worst" case scenarios on the same graph, you can see whether a property is marginal or a deal:
- marginal properties have an "expected case" line that stays flat or goes negative in the future
- great deals have a "worst case" line that's flat in the future.
The nice thing about rental properties vs the stock market is that you control them. If you own a rental business and the business somehow breaks, you can fix it yourself. Whereas no amount of your effort will get that stock price to go up.
Download the Spreadsheet
To view this material, you must be a paid and active member.